Your deck is full of pictures of charts
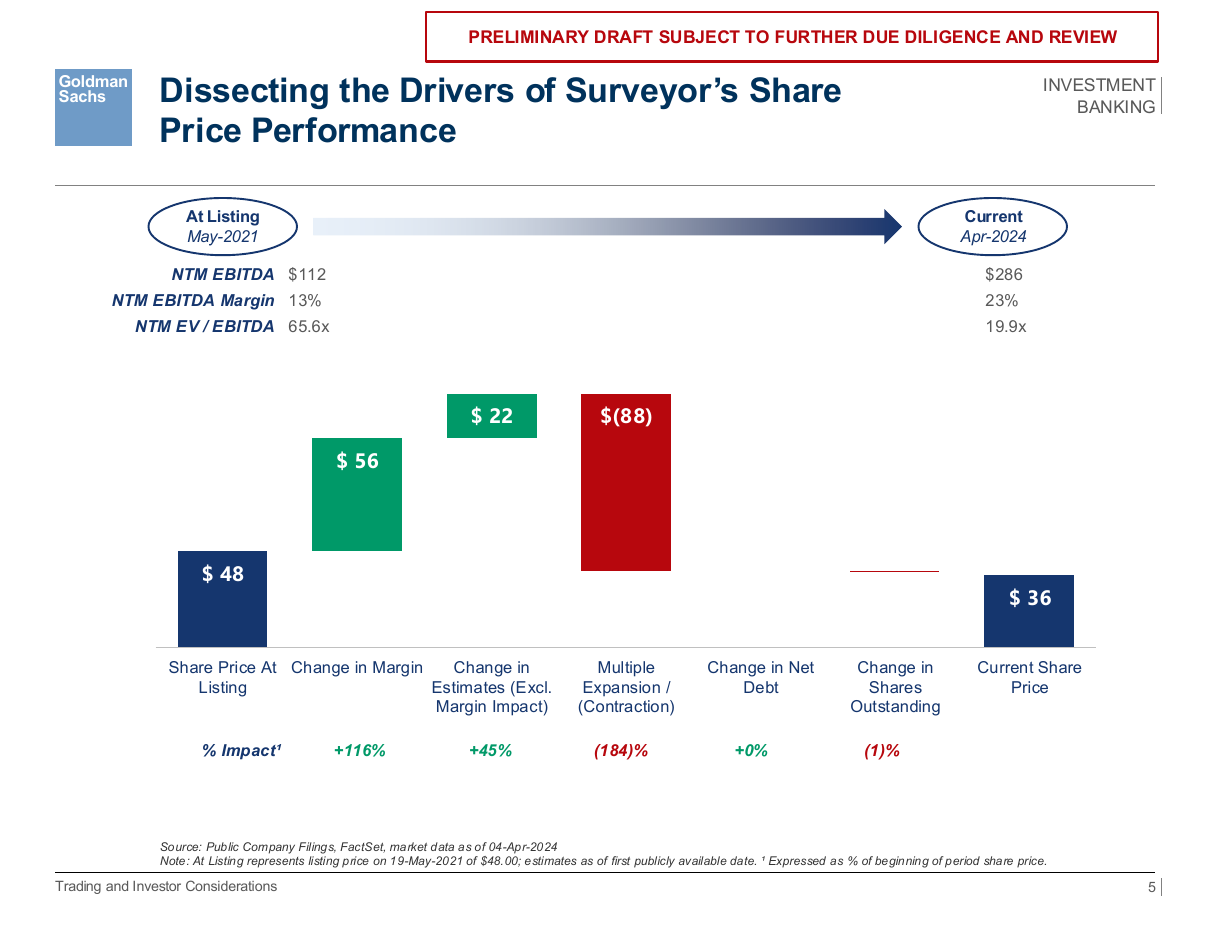
Here is a Monday morning that happens at every firm. The numbers moved over the weekend. An associate opens the deck to update it and discovers that the waterfall on page 5 is a screenshot, the comps table on page 12 is a picture of a table, and the axis labels on the bridge chart are text boxes floating near where the axis used to be. Updating the deck now means rebuilding it.
Decks decay into this state one shortcut at a time. Someone pastes a chart from a PDF because the source file is lost. Someone screenshots an old exhibit because the intern who built it left. Each paste looks fine in the meeting. The cost lands later, on whoever inherits the file.
The two-click audit
You can audit an inherited deck in about a minute. Click any chart once. If PowerPoint selects a chart object and offers you the data, it is real. If it selects a rectangle with handles, it is a picture. Click any table. If your cursor lands in a cell, it is a table. If the whole thing moves as one block, it is ink. Do this for every exhibit before you promise anyone a same-day turn.
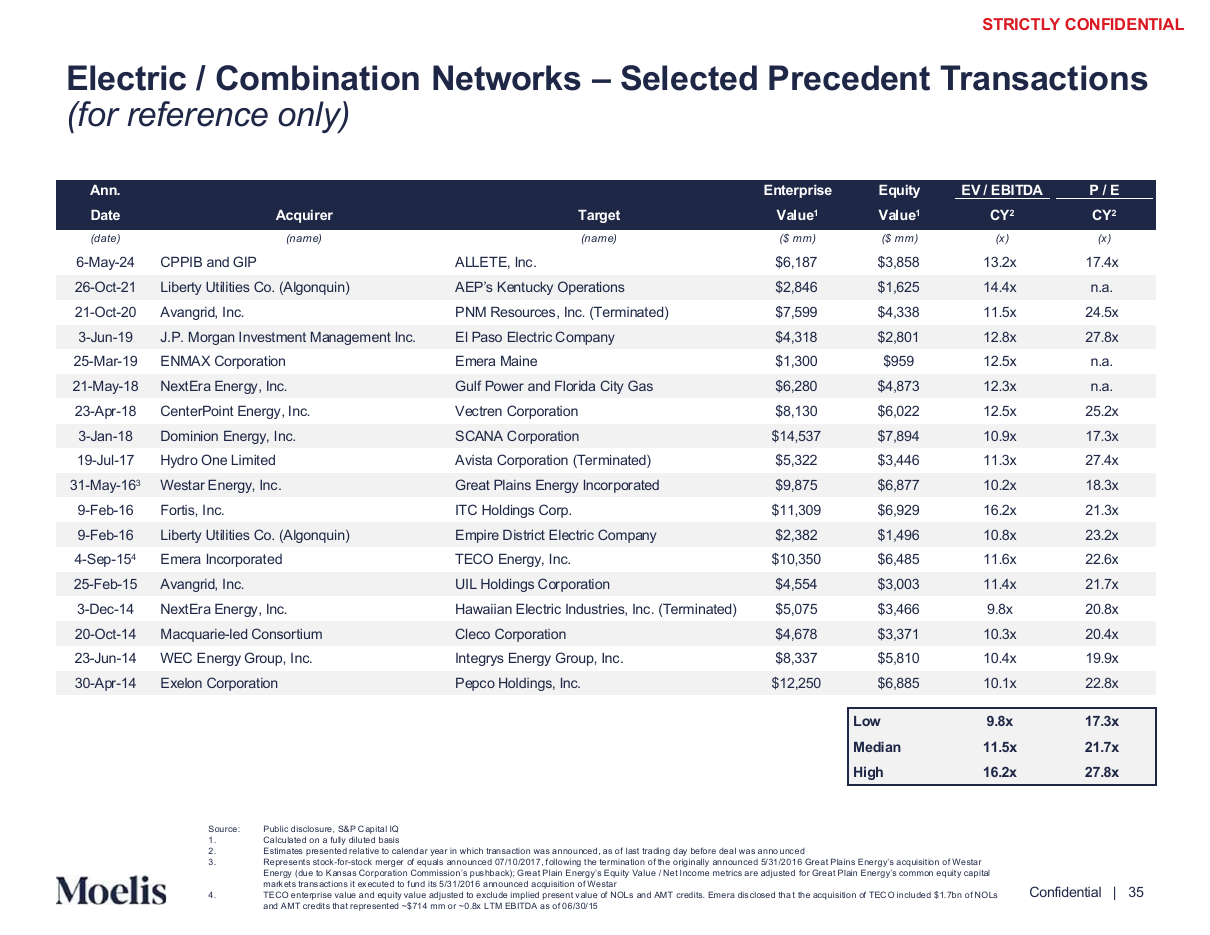
The distinction matters most in the slides that get updated most. A precedent transactions table gains a row every time a deal closes. When it is a real table, the new deal is one row and the summary statistics recompute. When it is a picture, the new deal is a trip back to whoever still has the source, if anyone does.
Why the bar is native objects
Bankers and consultants do not ship pasted pictures, and not out of fussiness. A deck is a living document for exactly as long as the deal is alive. Numbers change weekly. A book built from native objects absorbs those changes in minutes; a book built from pictures absorbs them in evenings. The share-price bridge above survives a new data point the same way a spreadsheet does. A screenshot of it would not survive a font change.
If an exhibit in your deck fails the two-click test, the fastest fix is usually not tracing over the picture. It is starting from a native version of the same layout and putting your numbers in. The library has editable waterfall charts and data tables recreated from real published decks, and every slide in it is a native recreation, not a theme pack of pictures. Open one in PowerPoint, click the chart, and you are in the chart.