The biggest financial slide template library
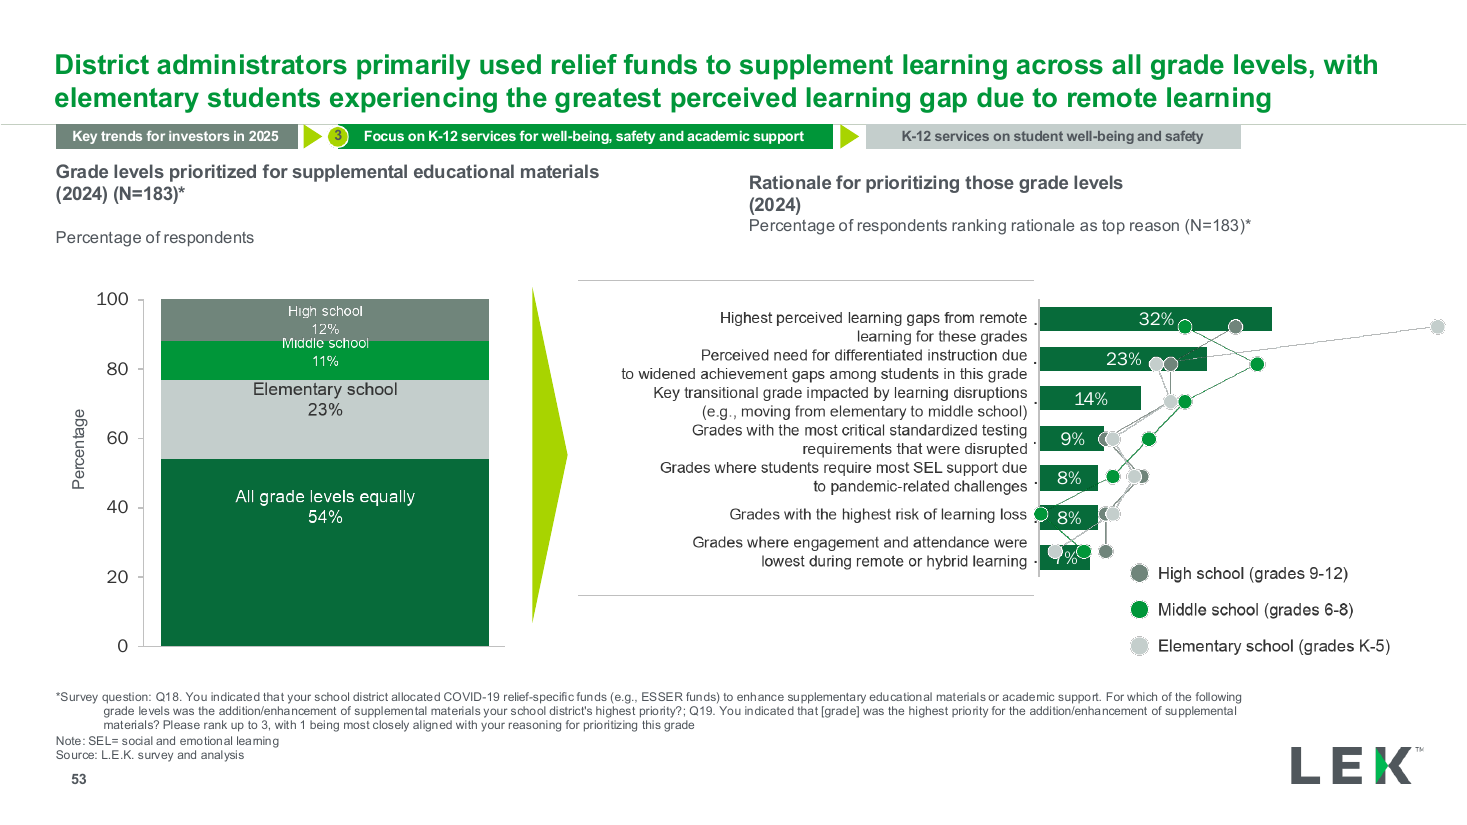
Most PowerPoint galleries sell you a theme: a title master, a few accent colors, and a folder of pictures that look like charts until you click them. That is fine for a kickoff deck. It falls apart the moment you need a market map, a precedent table, or a stacked bar that still behaves like Excel after you change the numbers.
The UltraOffice library is built the other way. Each template is a single slide recreated from a real, publicly published deck. Consulting strategy work from L.E.K. Consulting, EY-Parthenon, and BCG. Investment banking pitch books and board decks from Goldman Sachs, Morgan Stanley, Houlihan Lokey, Evercore, William Blair, Qatalyst Partners, Citi, and Moelis & Company. The chart is a real chart. The table is a real table. The layout survives editing, rebranding, and resizing.
Why native objects matter
A screenshot of a waterfall is a picture. You can crop it. You cannot restack the bars, swap the series, or put your own deal name in the axis without it looking pasted. Bankers and consultants do not ship pasted pictures. They ship slides their associates can still open on Monday.
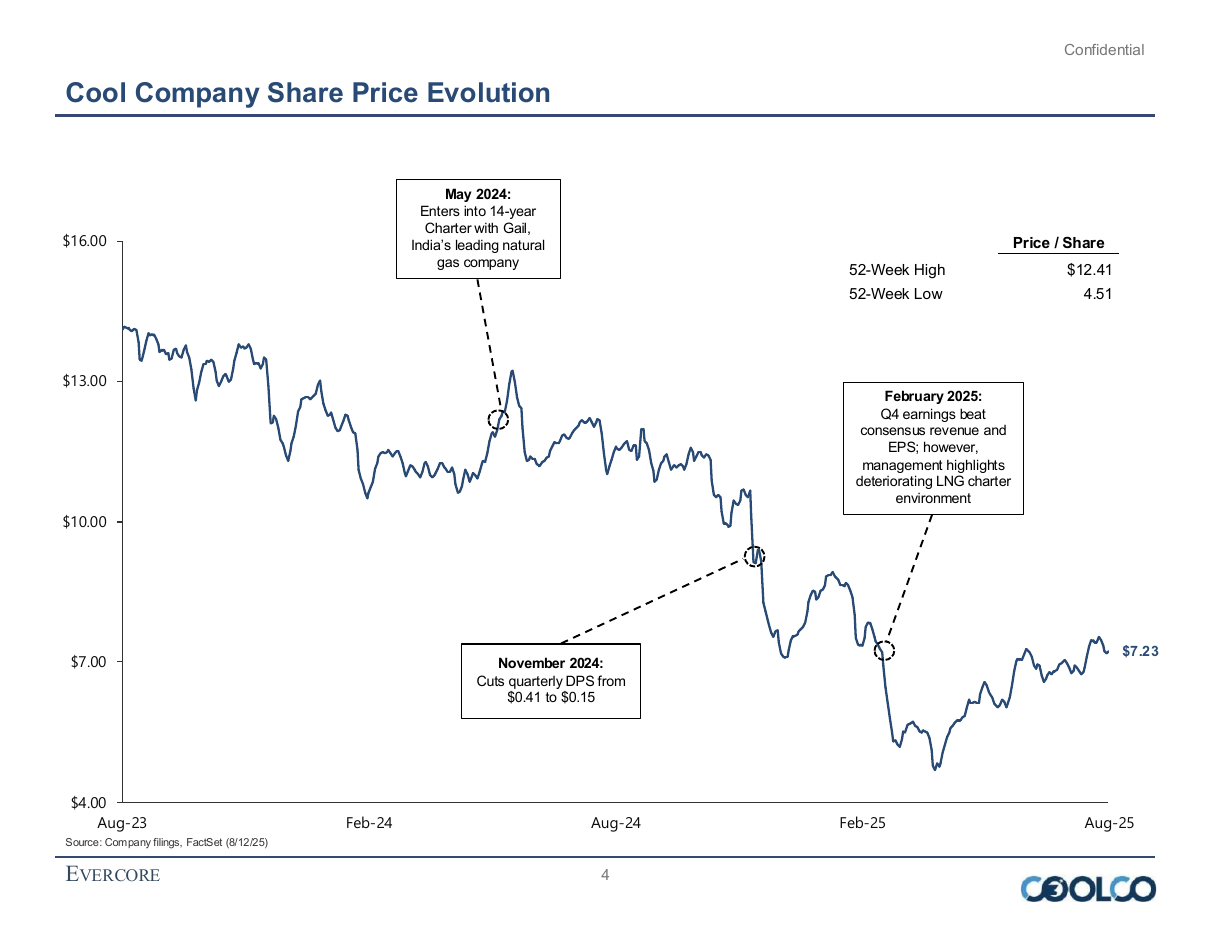
That is the bar for this library. Recreations are native PowerPoint objects, not flattened artwork. Open the file in PowerPoint, click the chart, and you are in the chart. Change a cell, keep the layout.
How to use them
Download a slide and drop it into an existing deck if you already work in PowerPoint. Or open it in UltraOffice and let the workspace swap in your data, apply your brand, and build the rest of the deck around that one slide. The library is the starting point. Your numbers and your look stay yours.
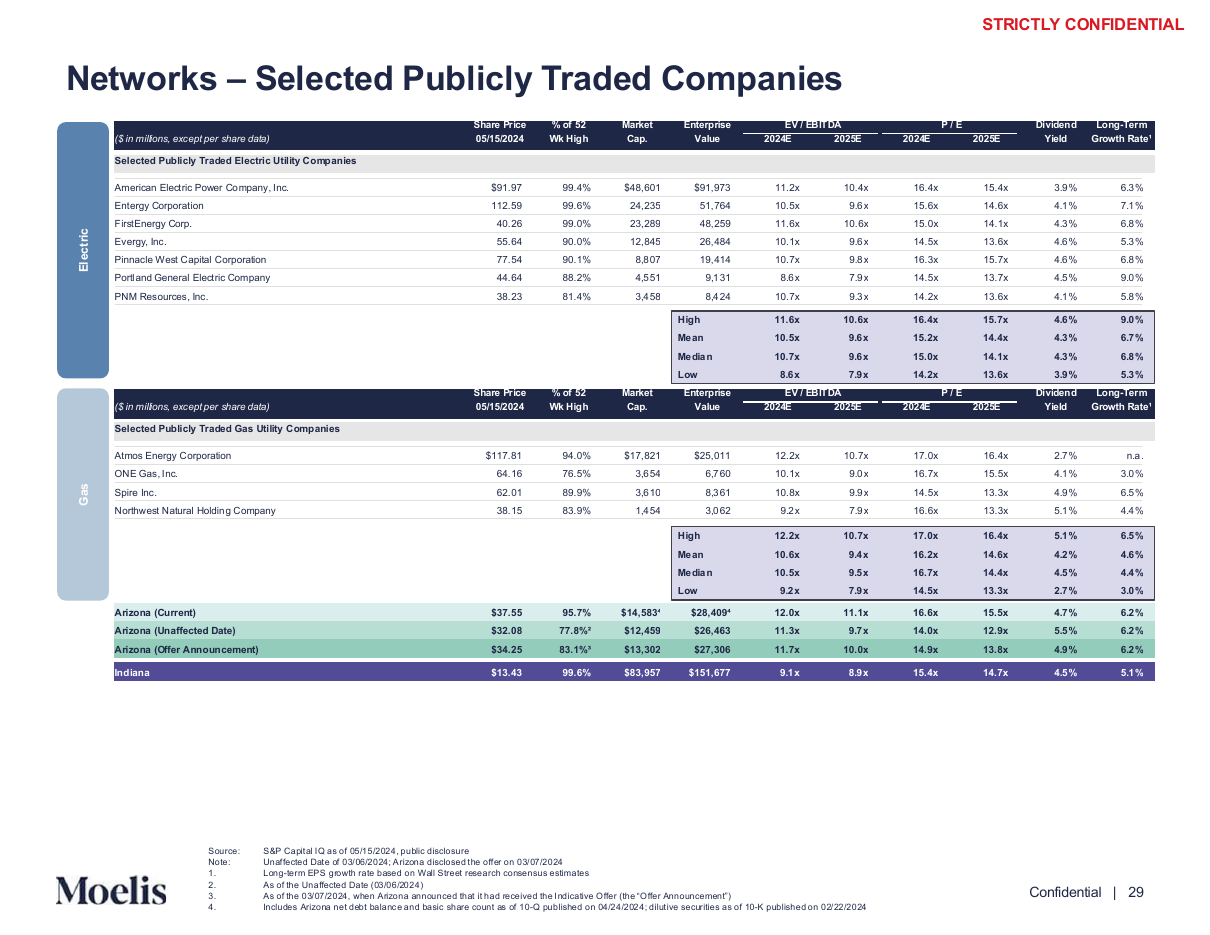
Browse the slide templates. Filter by audience or slide type, pick one, and start from a real layout instead of a blank master.