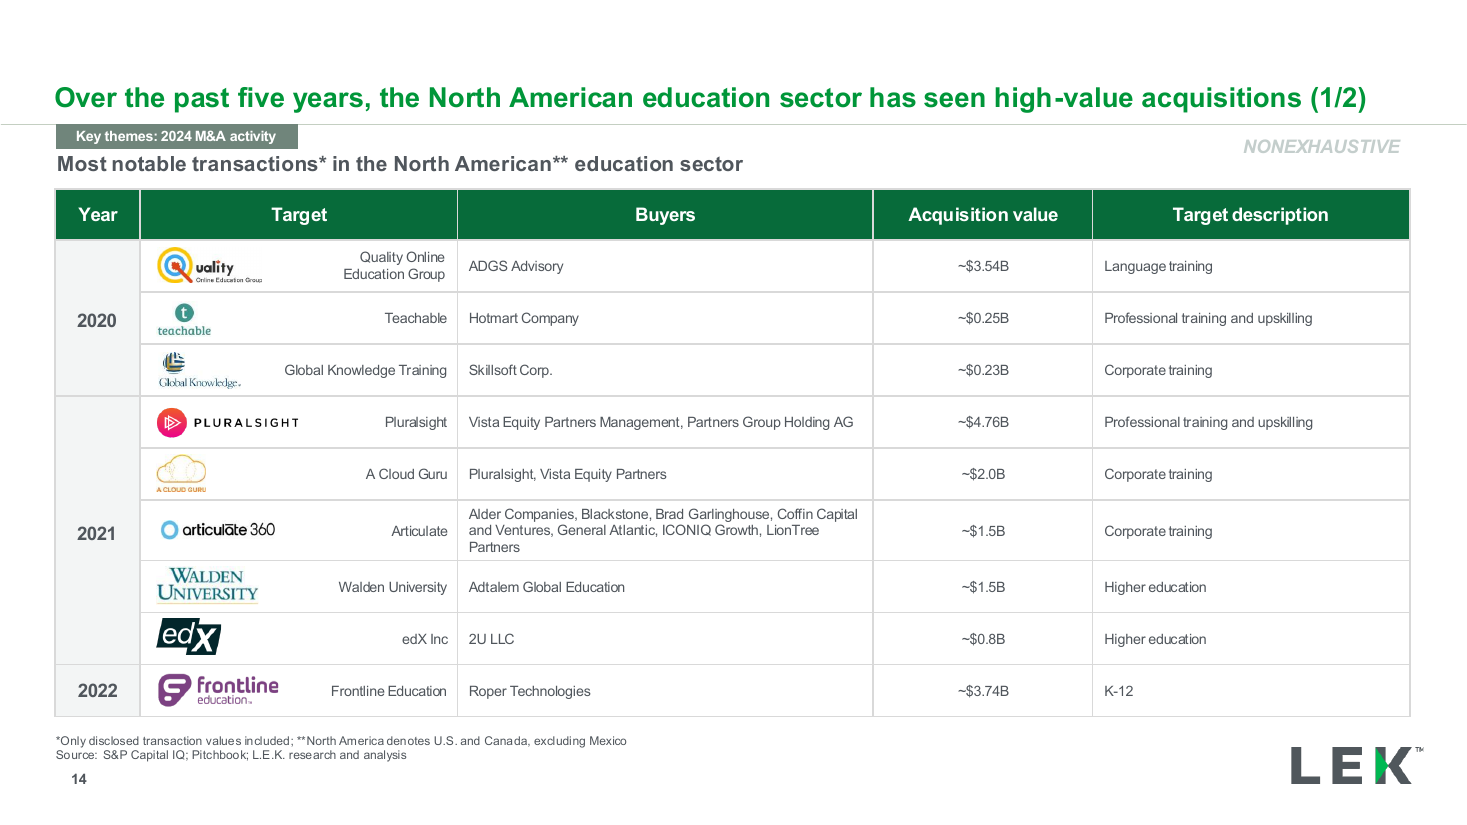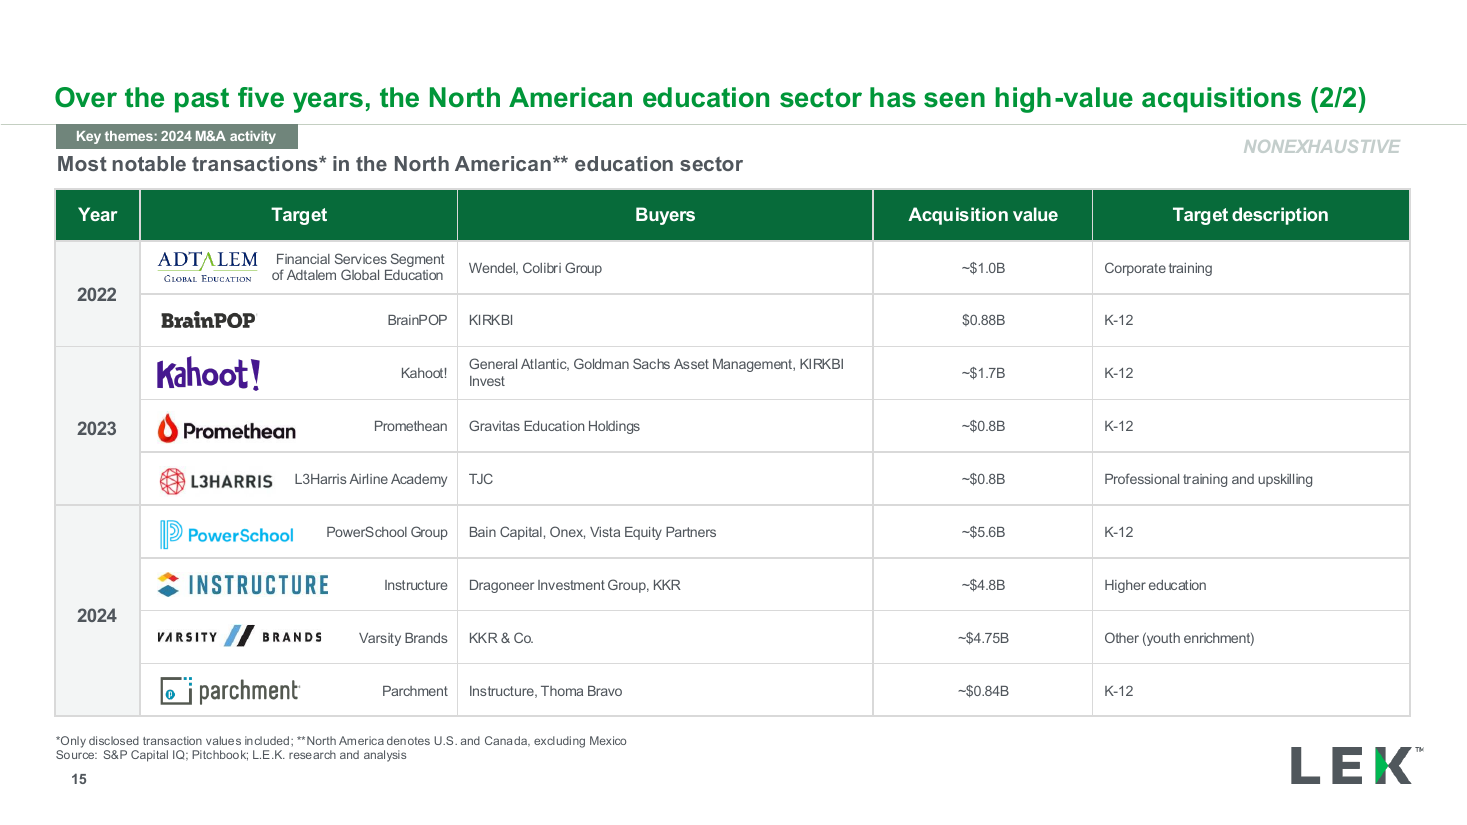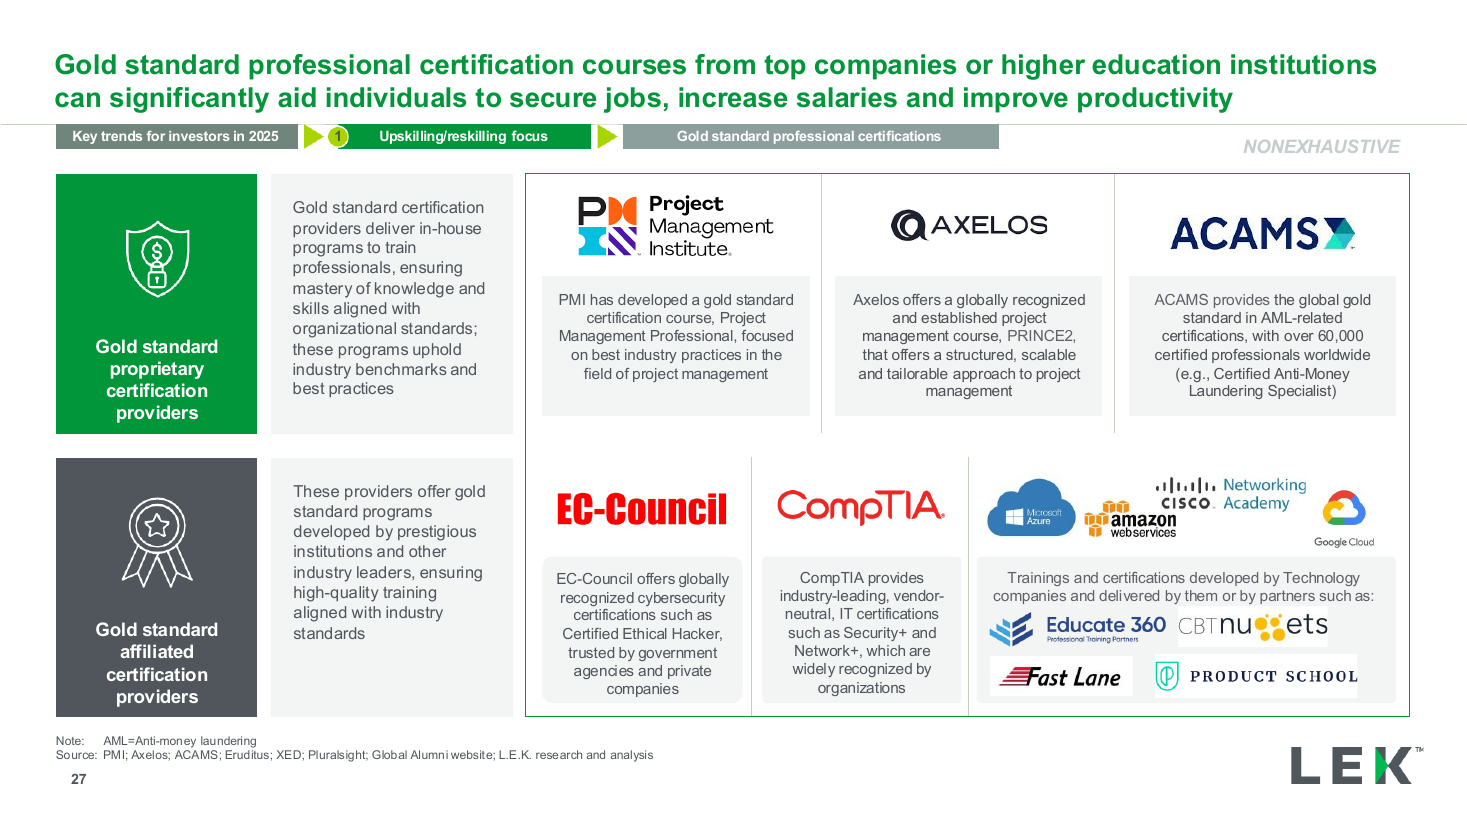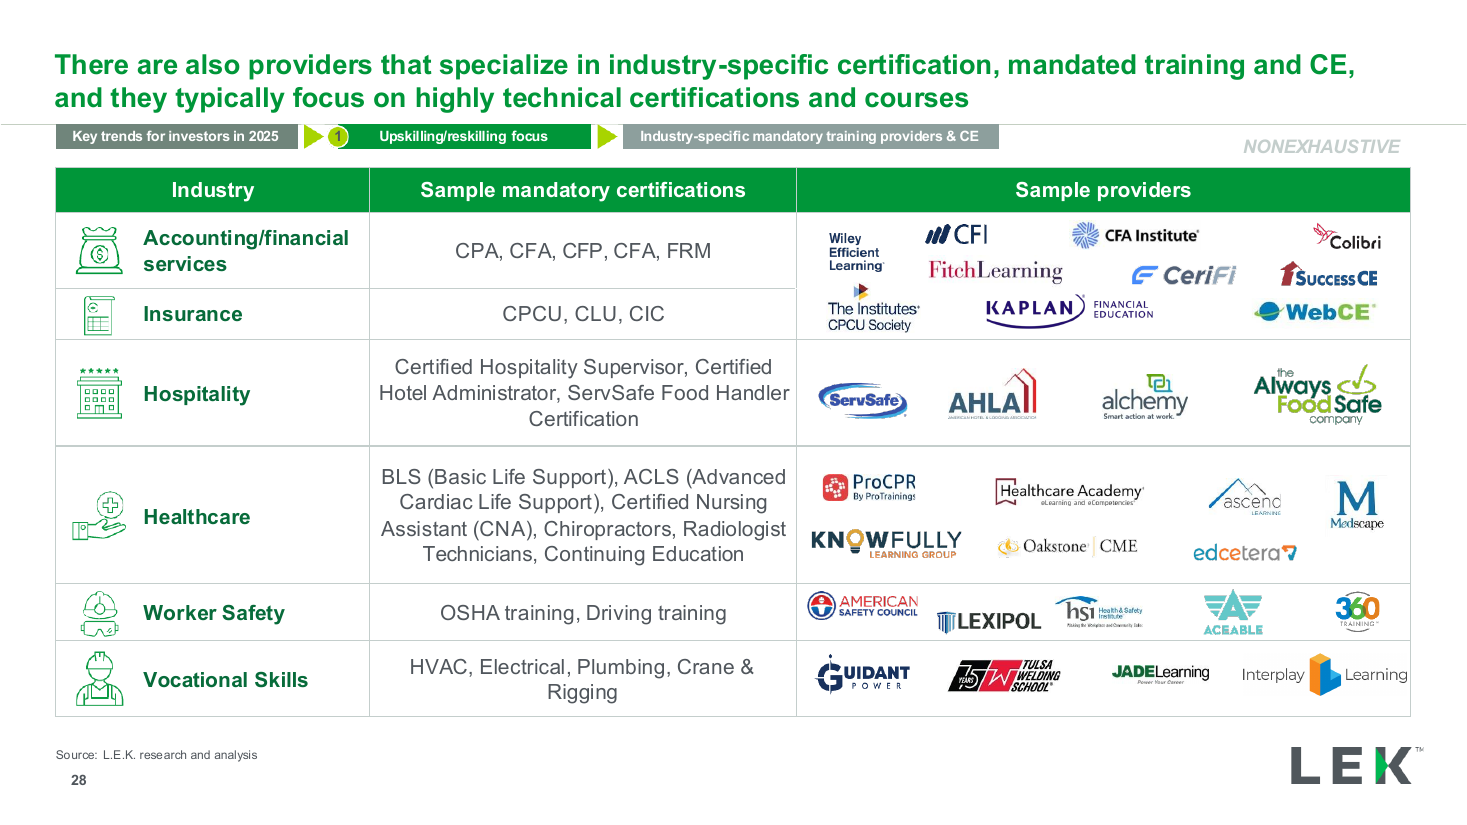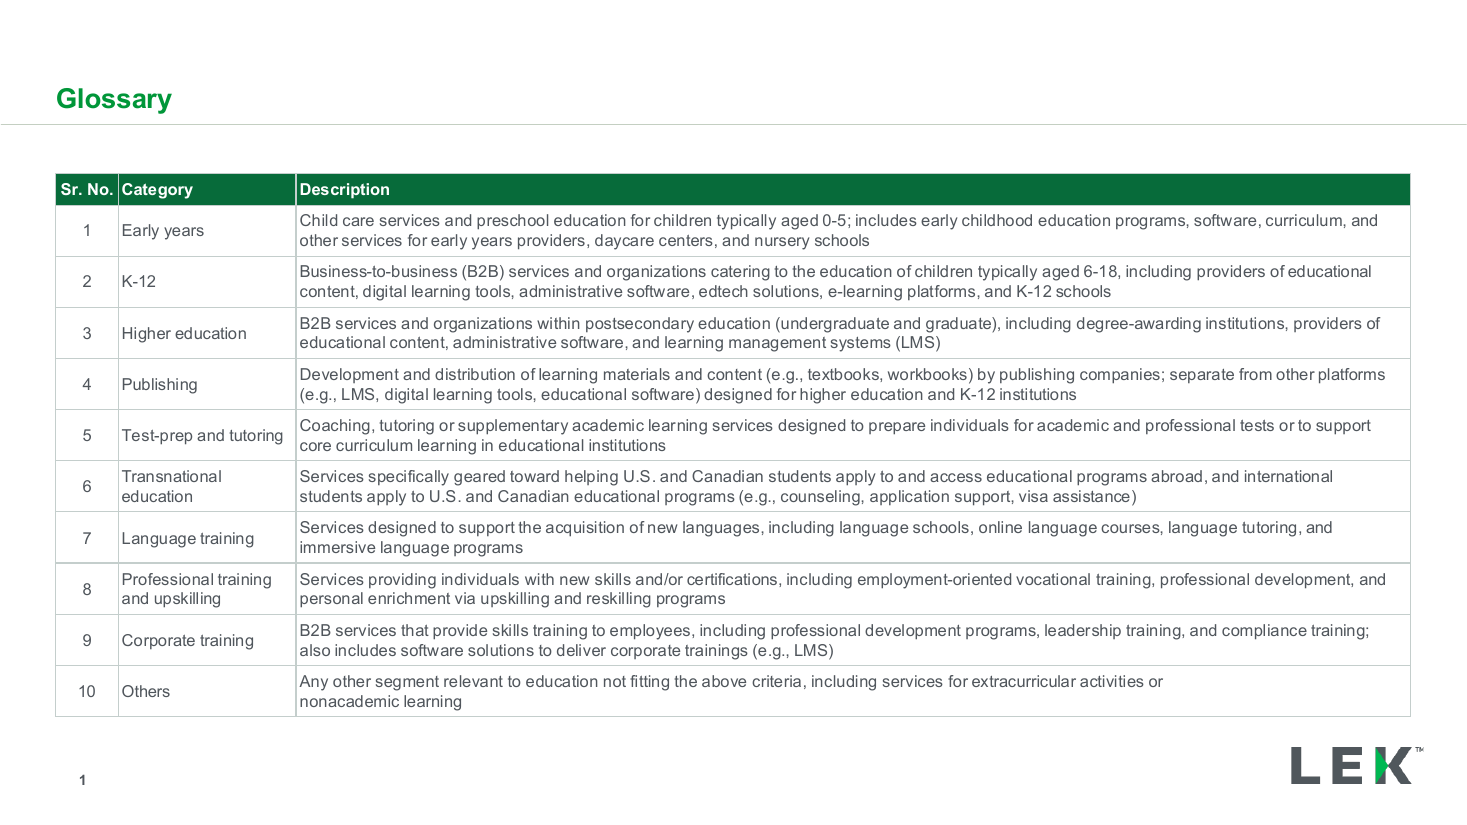
Segment glossary and category definitions table
The same sum-of-the-parts frame driven by comparable-company multiples for one forecast year, with the equity bridge and per-share range beneath.
Source: Recreated as a native, fully editable PowerPoint slide from page 17 of Avangrid Project Lean Pitch Book 2024, a publicly published Moelis & Company deck. Not affiliated with or endorsed by Moelis & Company.
More like this