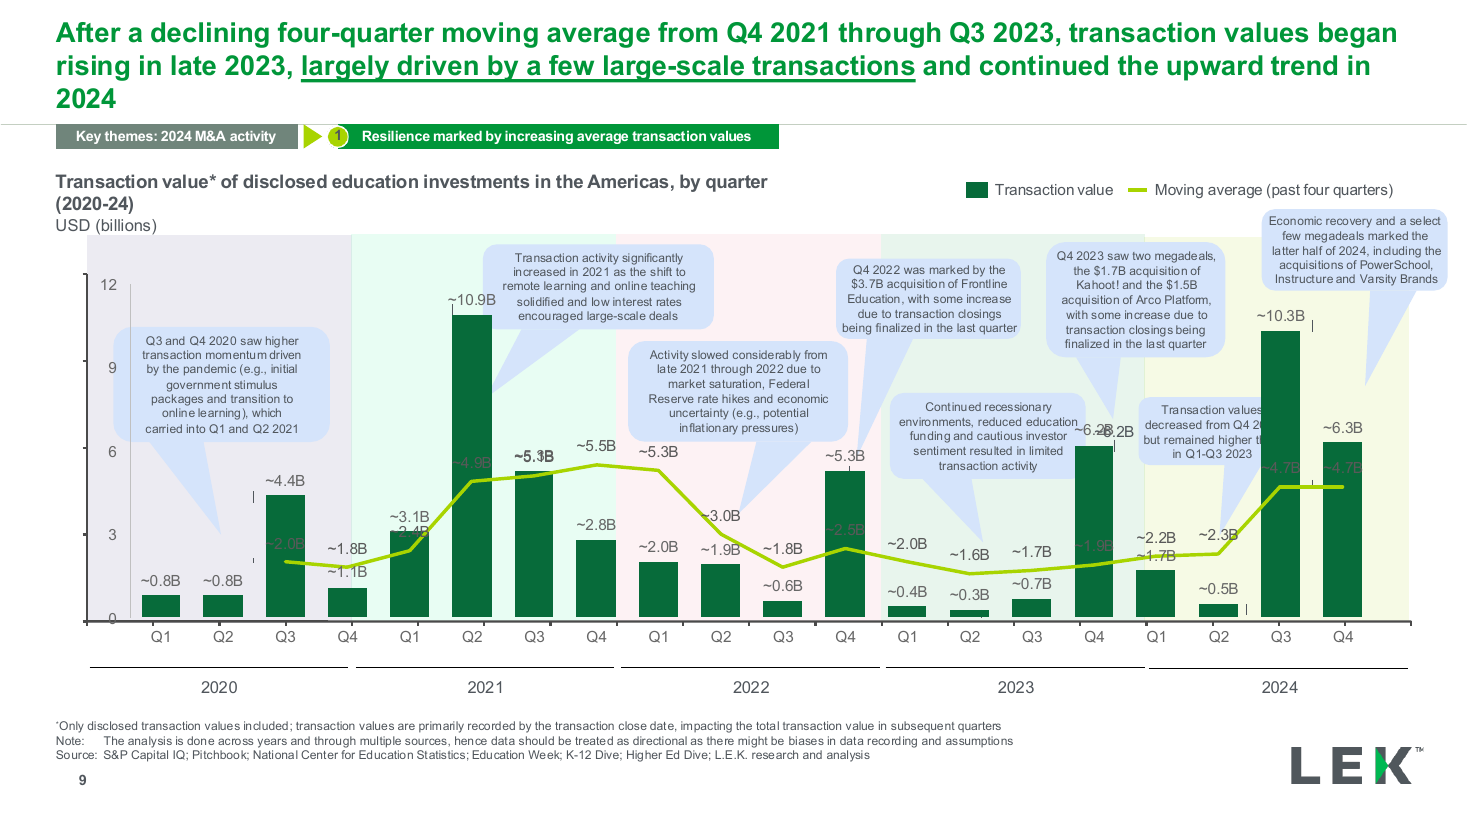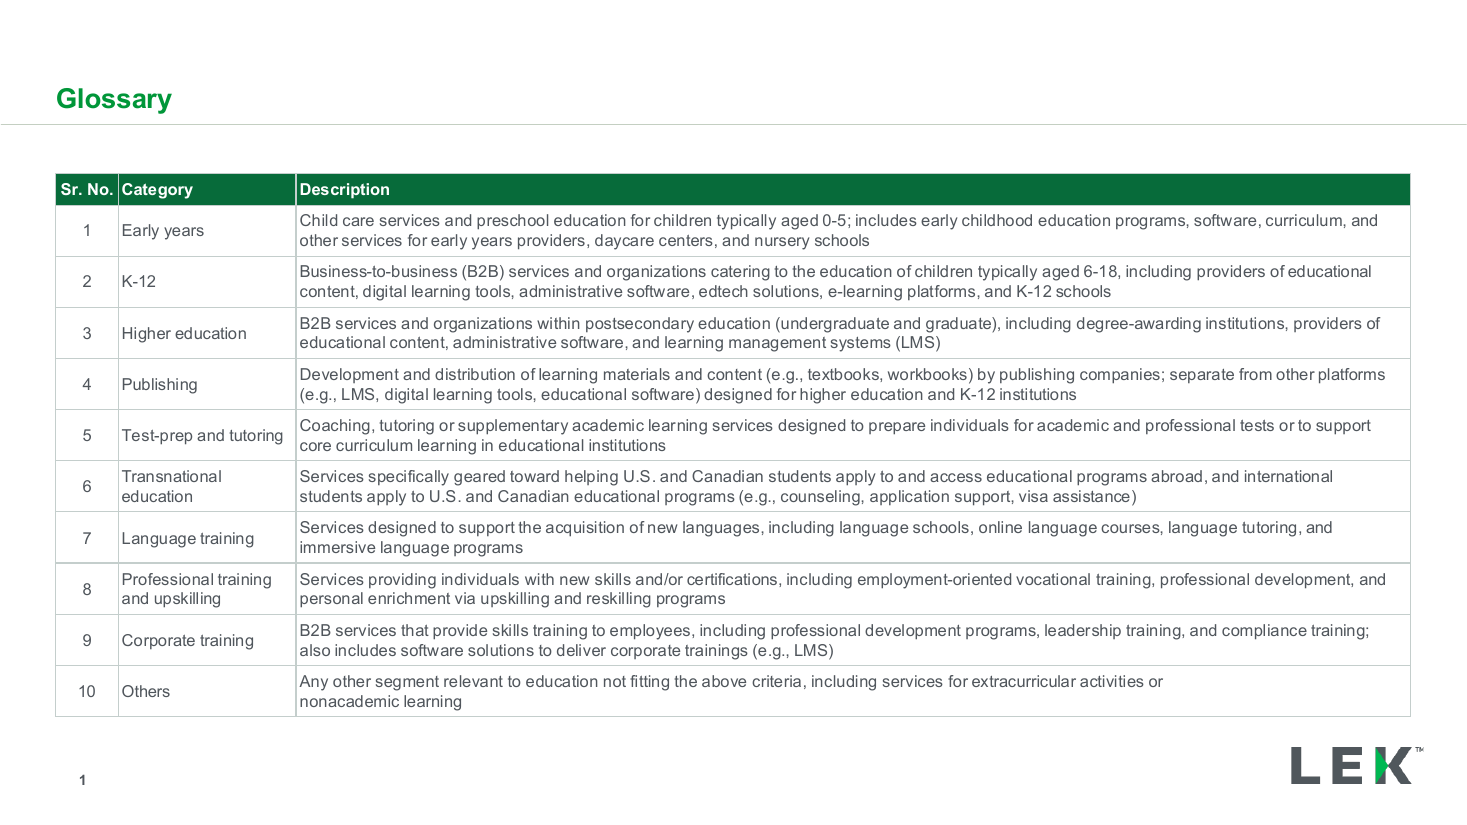
Segment glossary and category definitions table
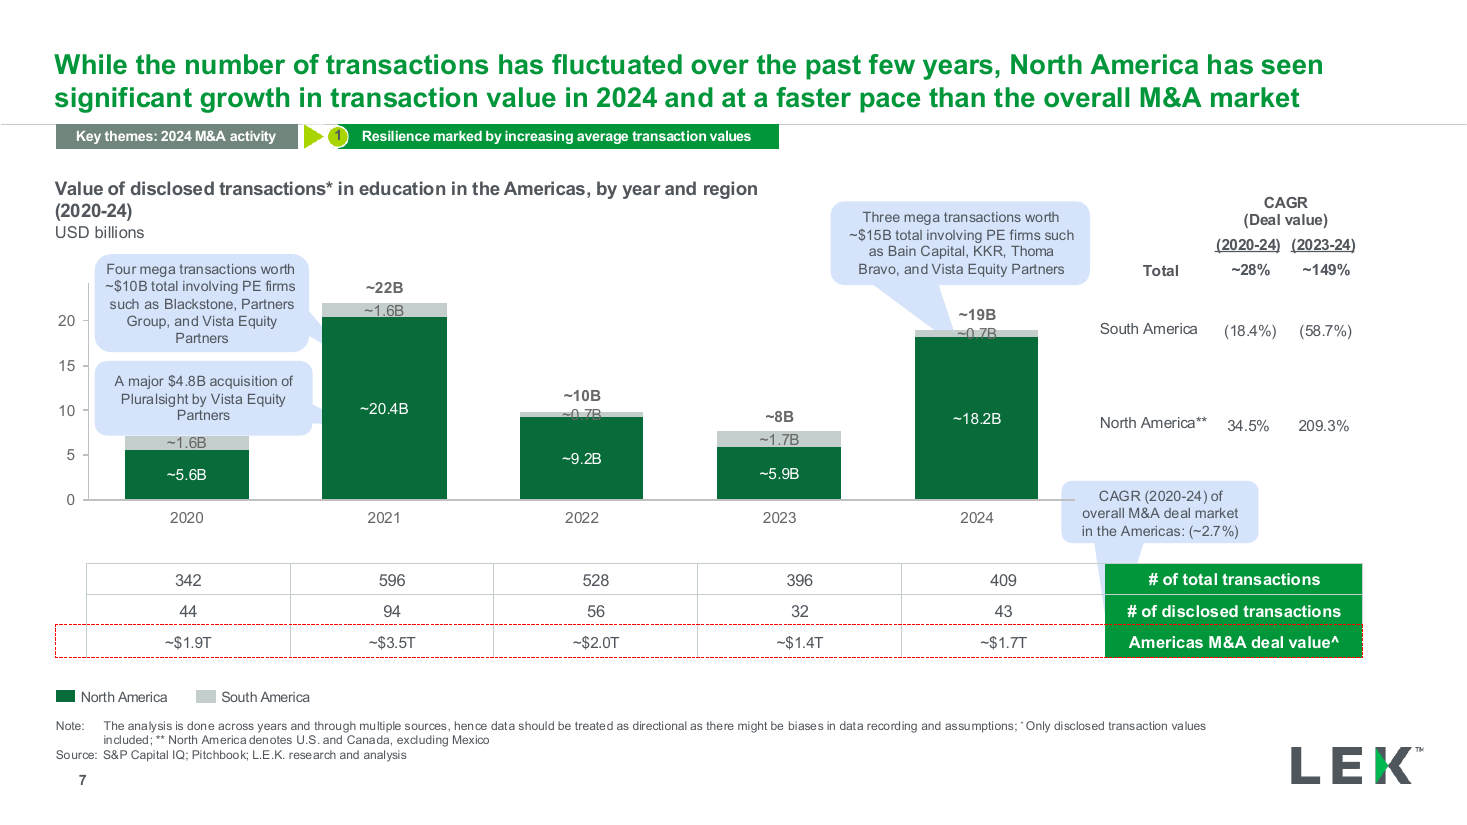
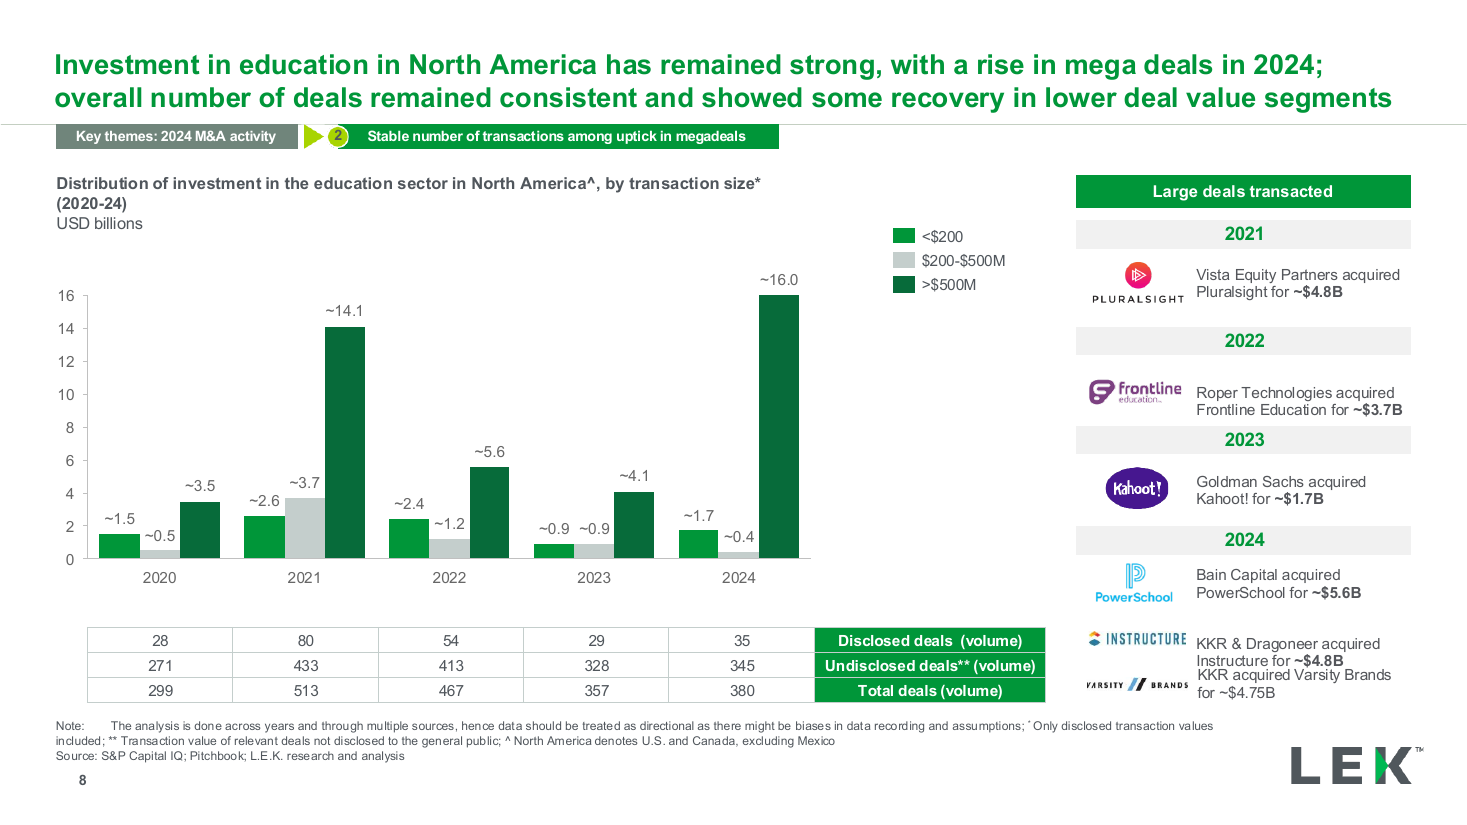
A 5-year stacked column chart of deal value segmented by transaction-size bucket, with per-segment dollar value and transaction-count labels, annotation callouts explaining each year's story, a CAGR summary table, and a side panel listing that year's notable target companies by logo.
Source: Recreated as a native, fully editable PowerPoint slide from page 73 of Education M&A Roundup 2024 and Trends for 2025, a publicly published L.E.K. Consulting deck. Not affiliated with or endorsed by L.E.K. Consulting.
More like this