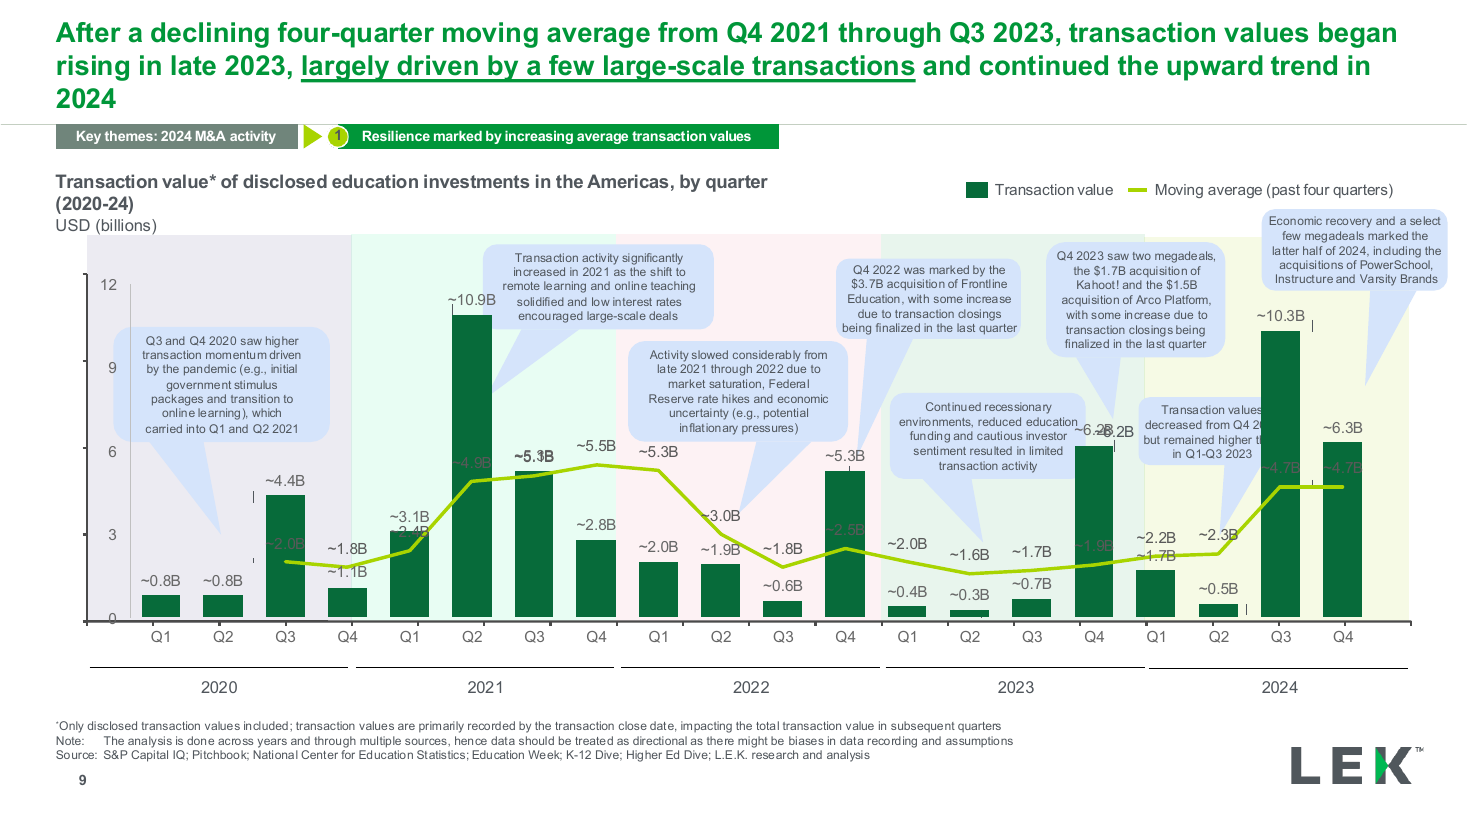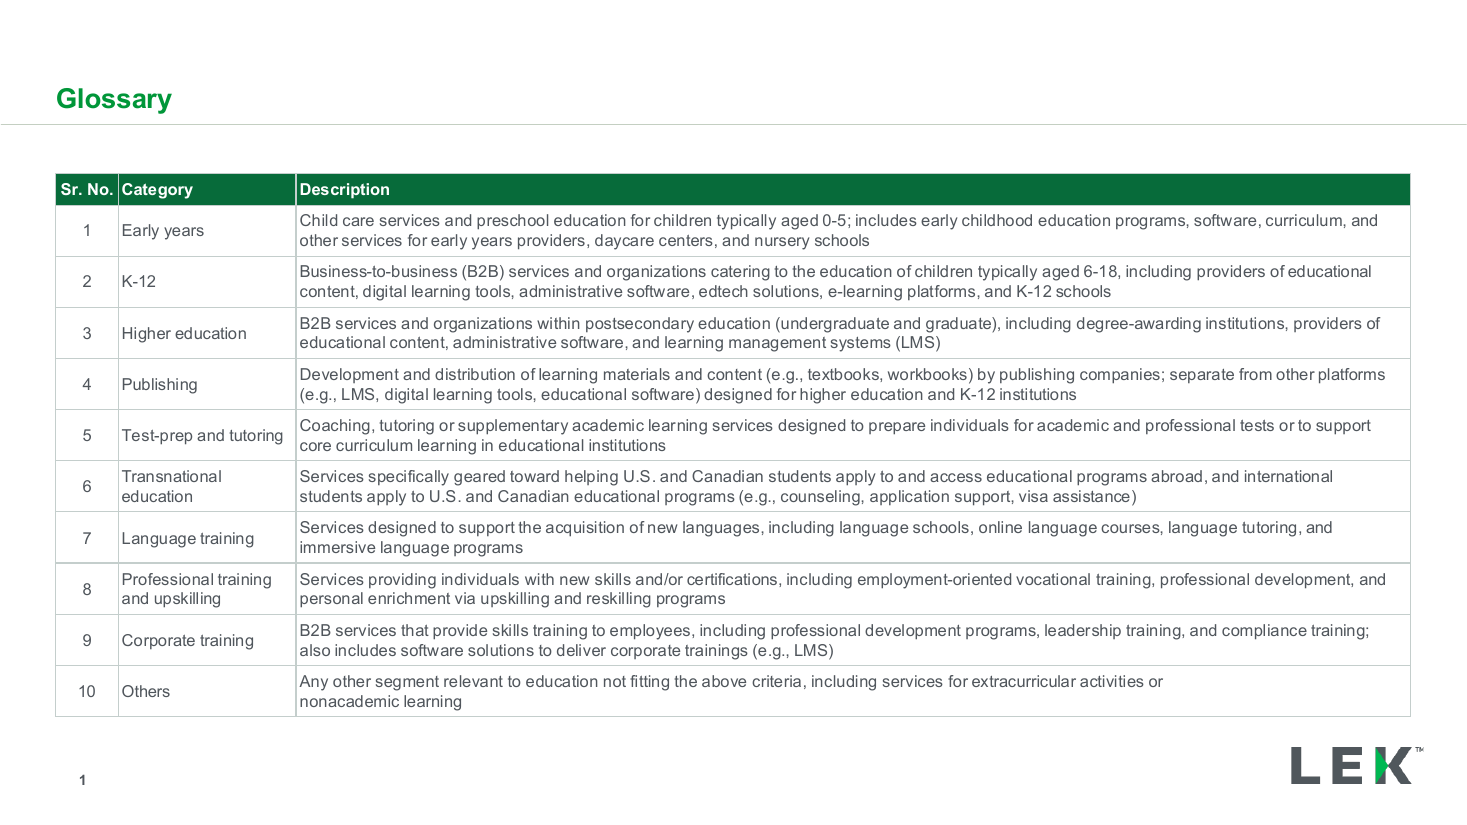
Segment glossary and category definitions table
A horizontal bar chart of estimated global AI-centric technology spend by industry, with one bar highlighted in a distinct accent color, paired with a right-side panel of three icon-led boxes explaining barriers to adoption. Use it to size a market and explain why it lags.
Source: Recreated as a native, fully editable PowerPoint slide from page 62 of Education M&A Roundup 2024 and Trends for 2025, a publicly published L.E.K. Consulting deck. Not affiliated with or endorsed by L.E.K. Consulting.
More like this