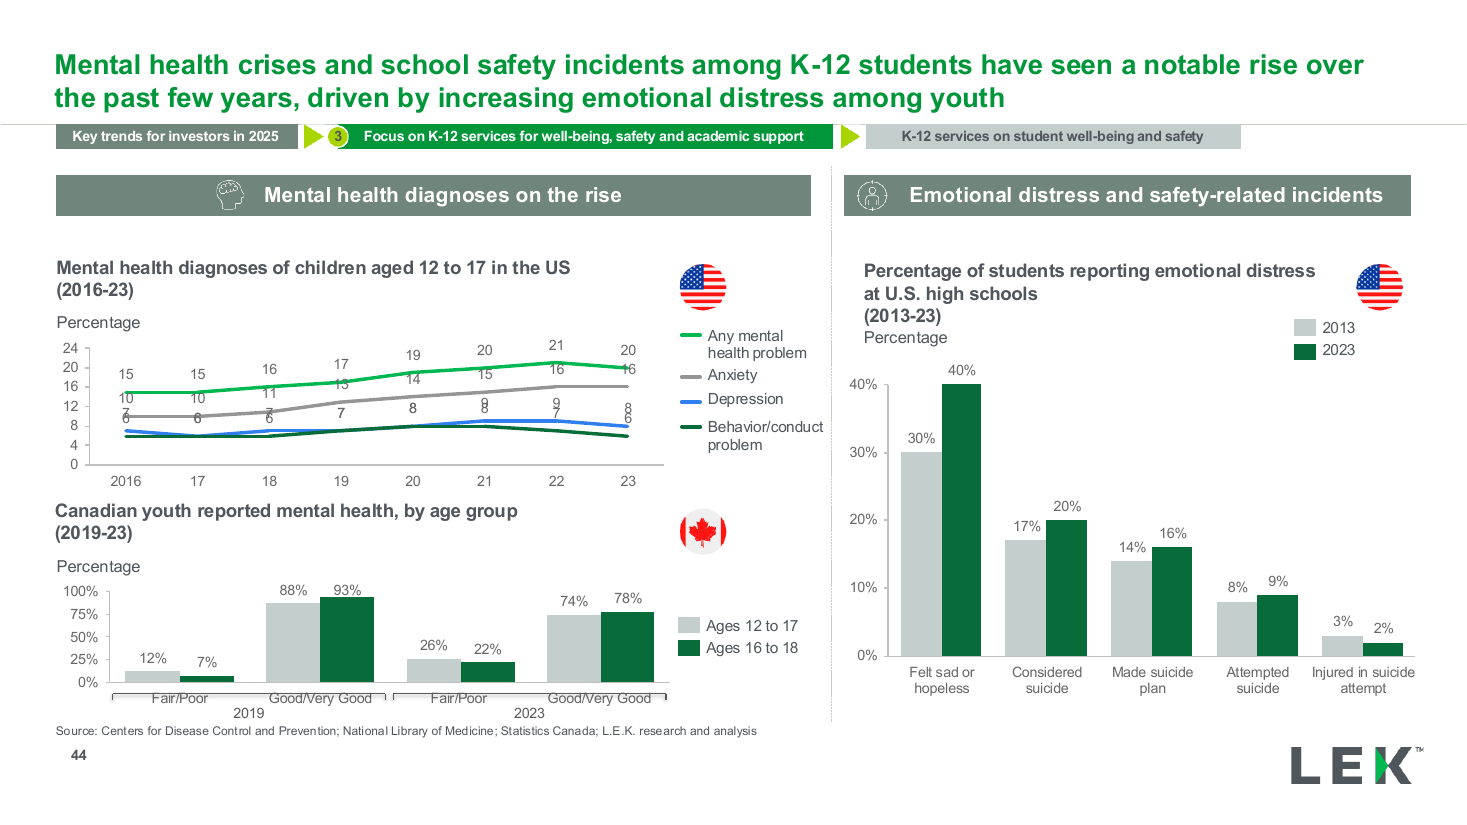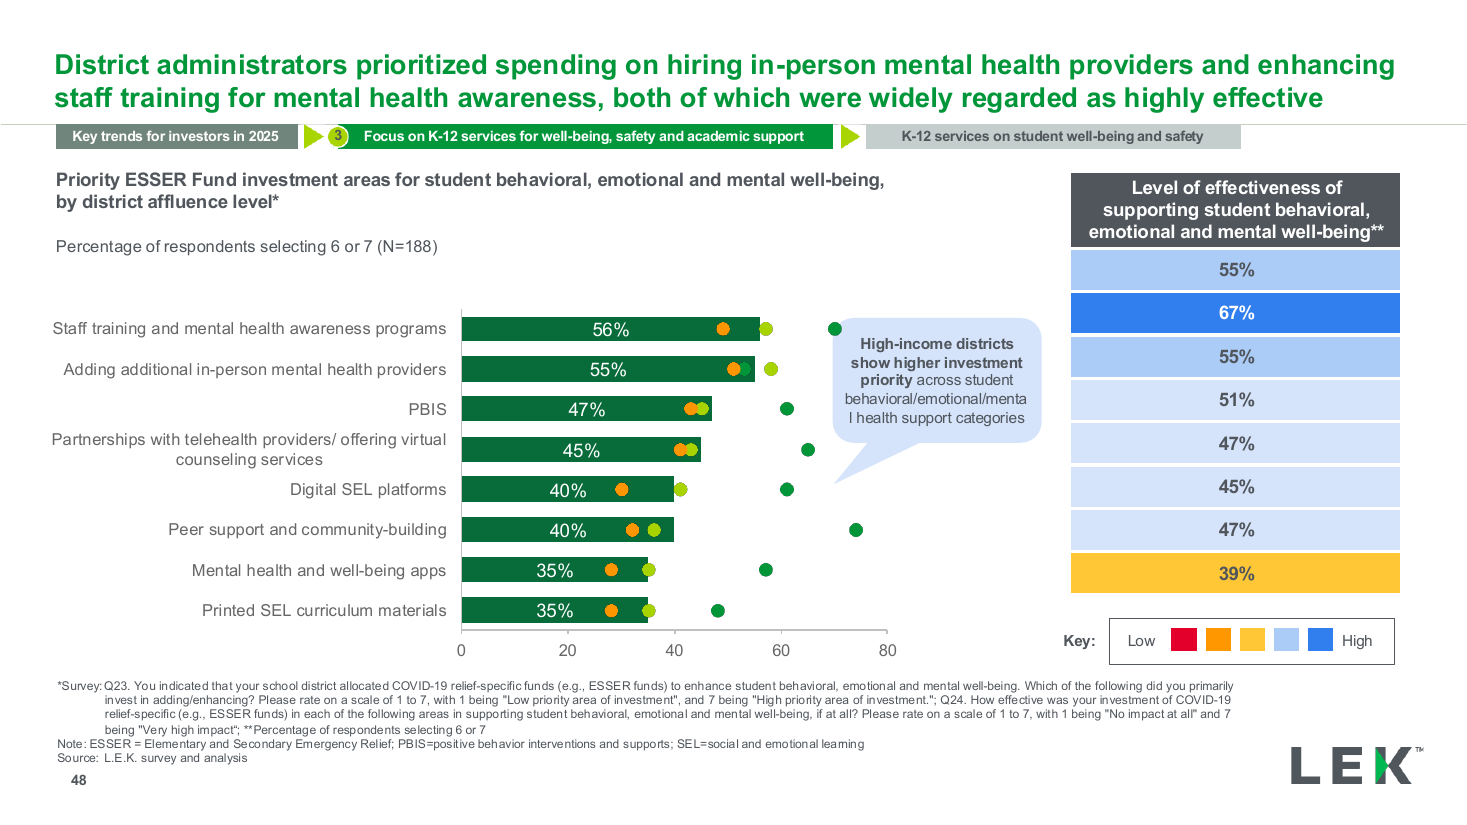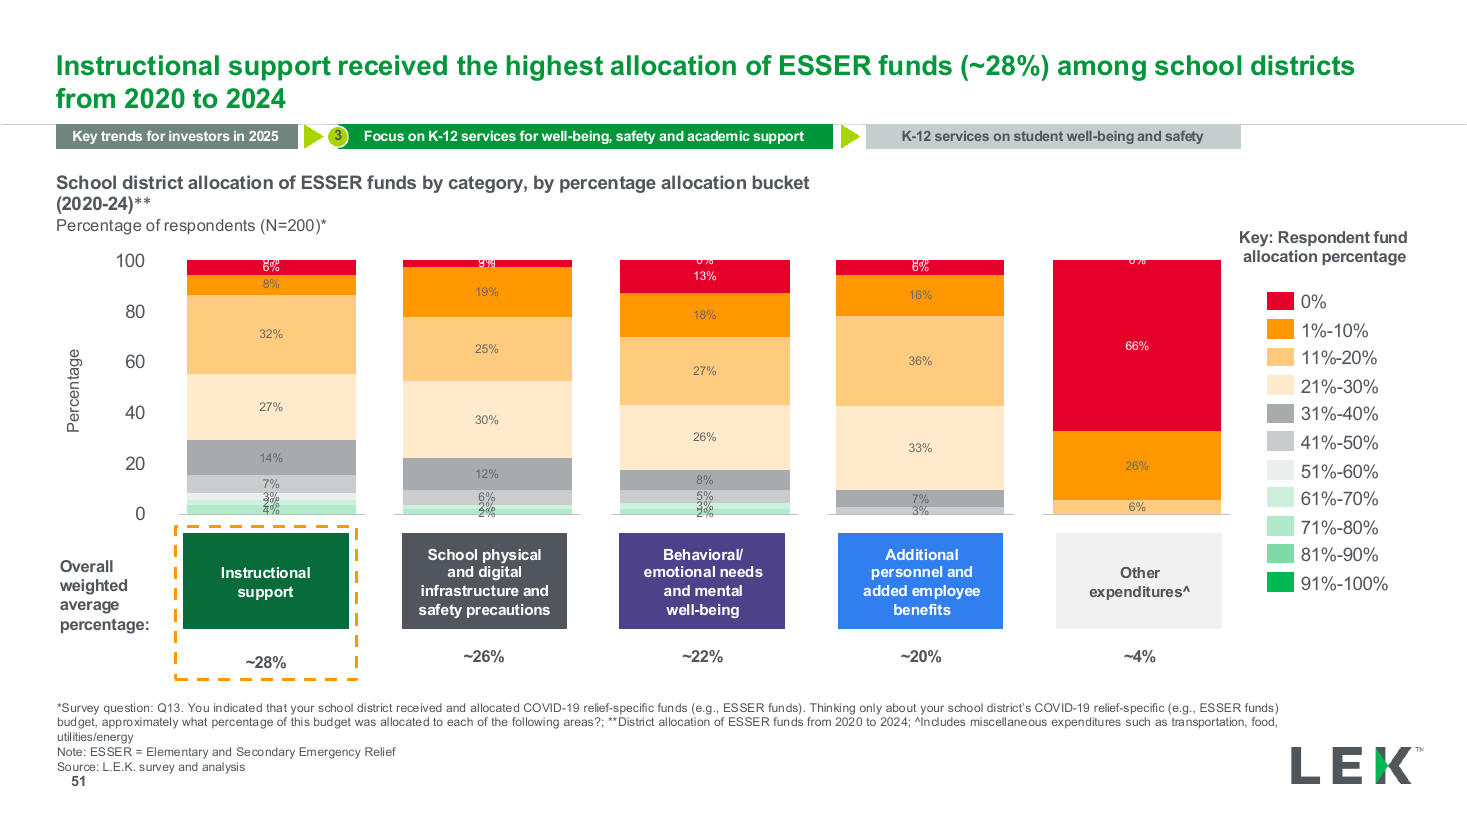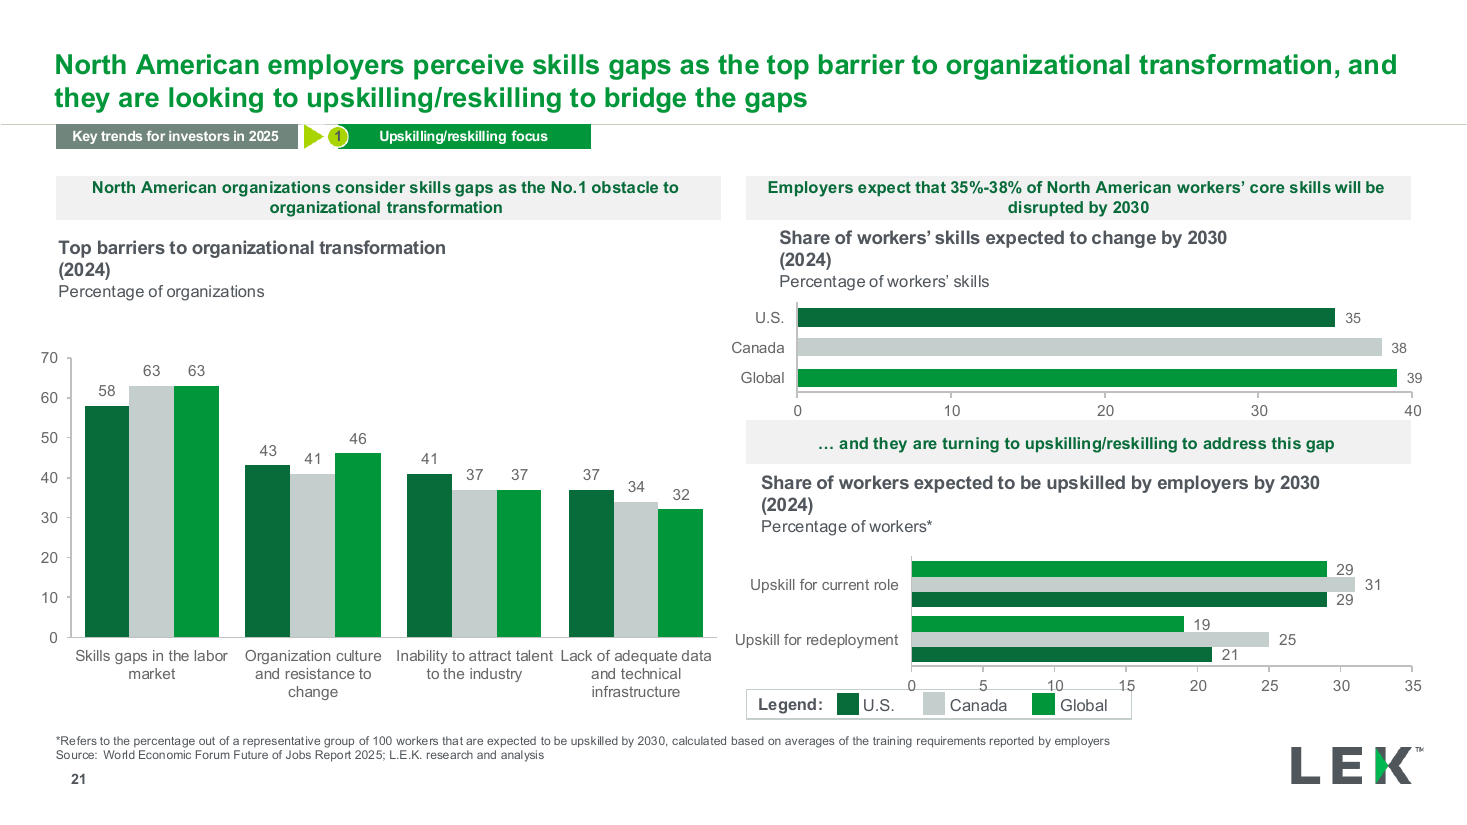
Skills gap survey three-chart panel
Two column charts of matched size, one showing a forecast distribution across four bands and the other a preference across five options, with commentary callouts and takeaway lines. Use it to put a market forecast next to a commercial choice.
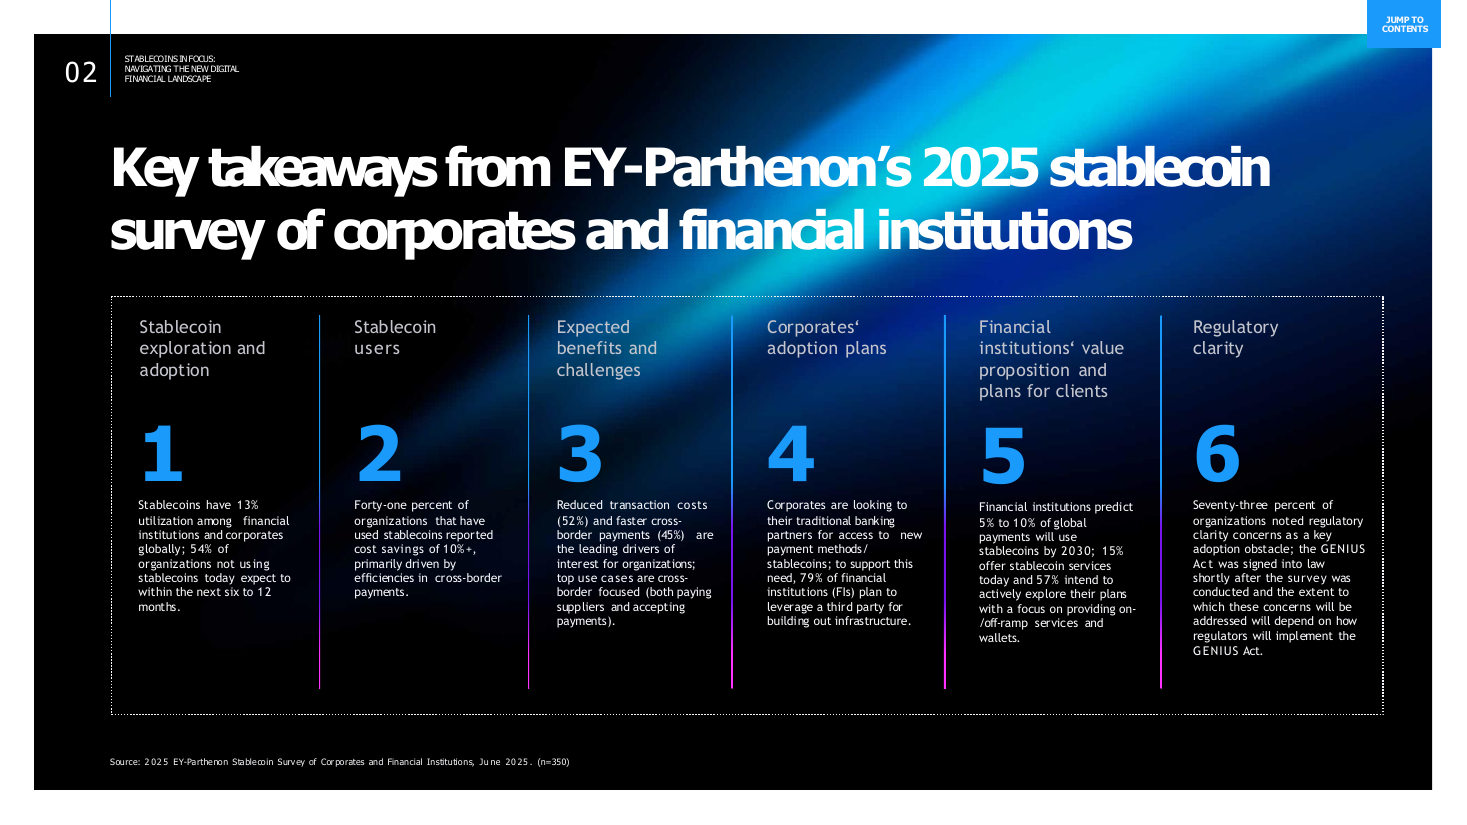
Source: Recreated as a native, fully editable PowerPoint slide from page 26 of Stablecoins in Focus 2025, a publicly published EY-Parthenon deck. Not affiliated with or endorsed by EY-Parthenon.
More like this