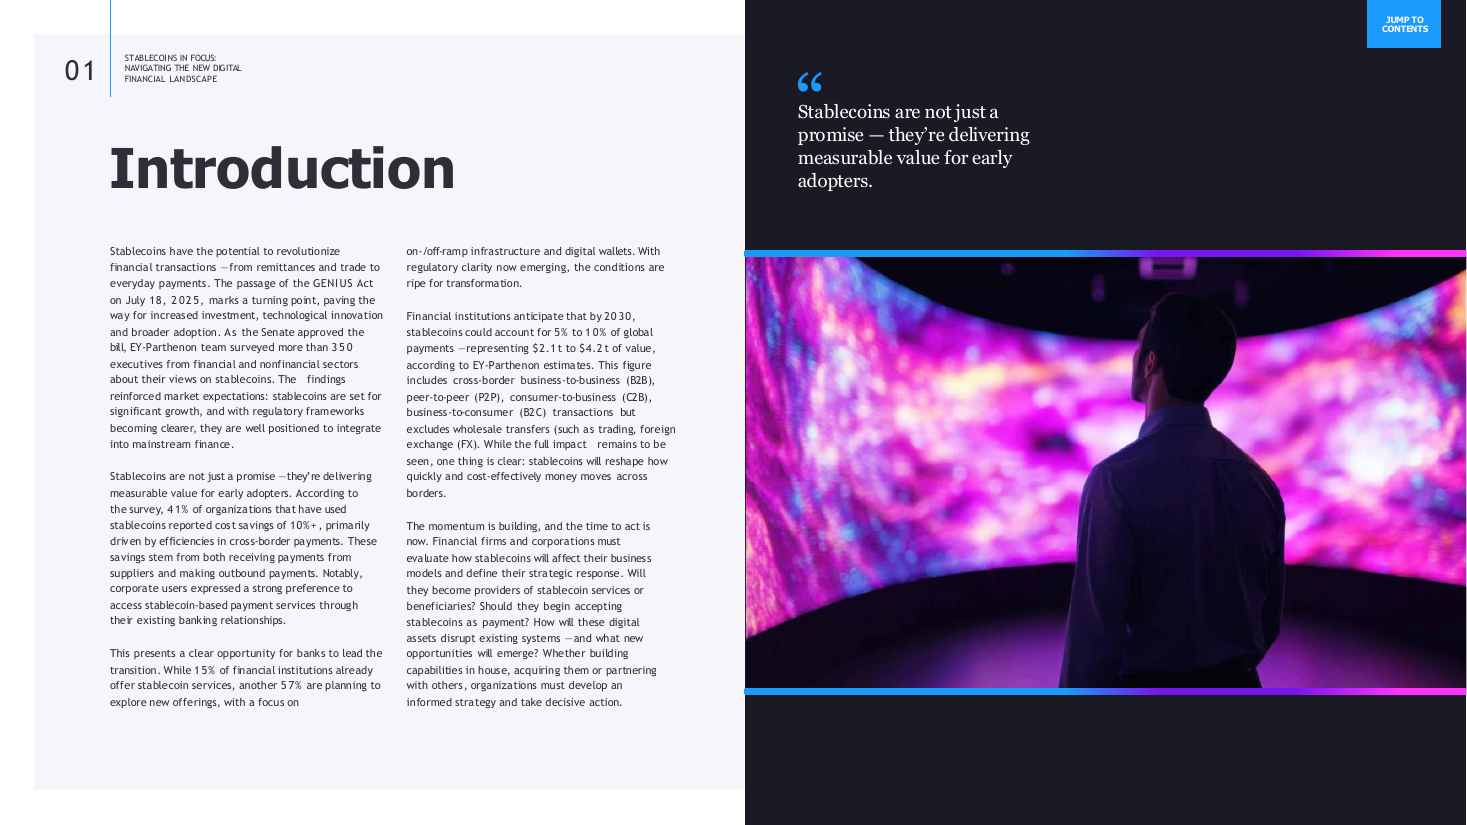
Section introduction with two-column essay and pull quote
A highlights page built from five numbered circles, each introducing its own small exhibit: a donut, a ranked bar chart, a numbered list and a column chart, with a dark statistics box anchoring the left column. Use it as the visual summary of a survey.
Source: Recreated as a native, fully editable PowerPoint slide from page 5 of Stablecoins in Focus 2025, a publicly published EY-Parthenon deck. Not affiliated with or endorsed by EY-Parthenon.
More like this