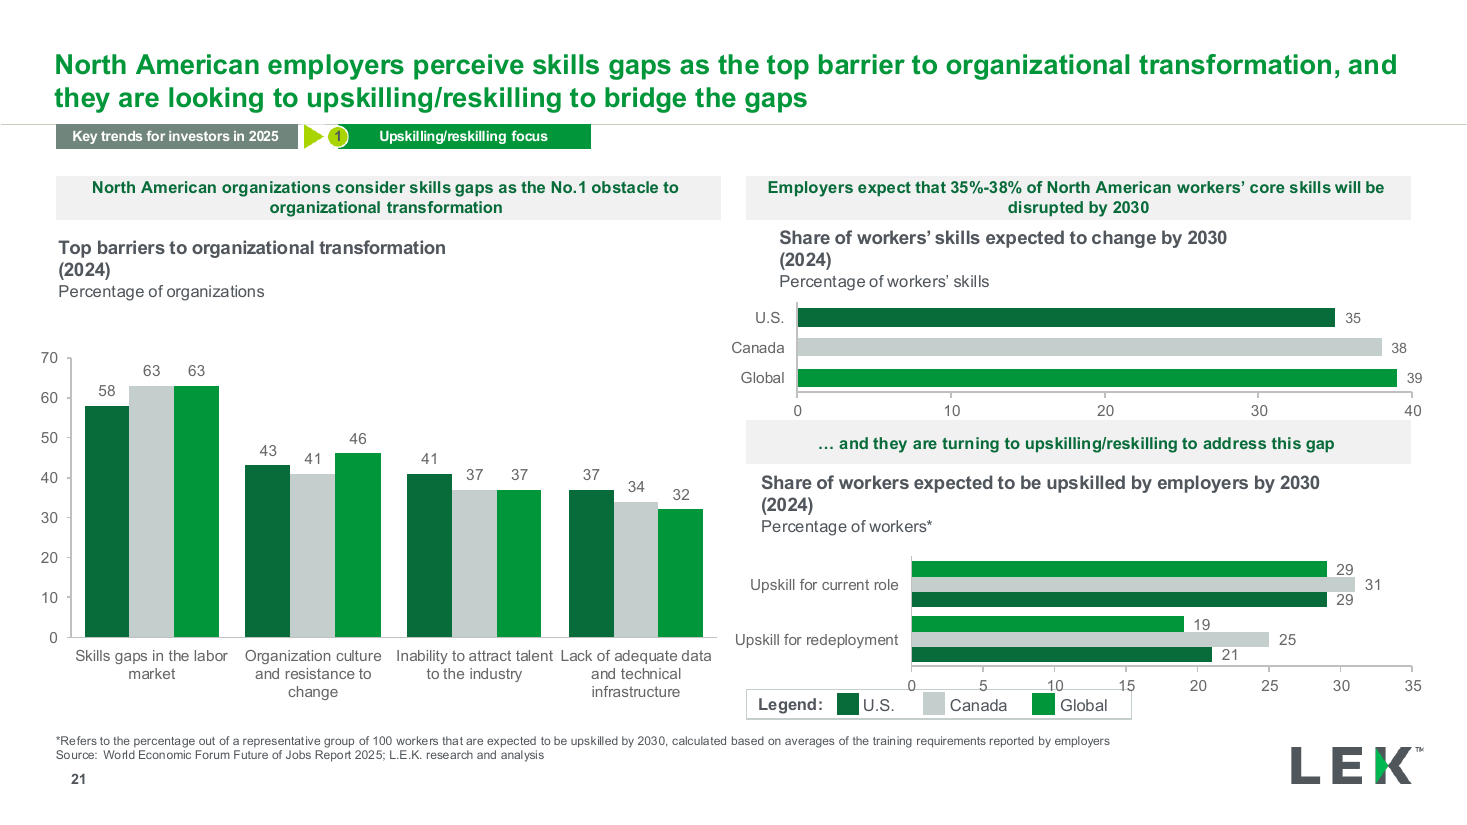
Skills gap survey three-chart panel
A four-option column chart on the left and, on the right, a 100 percent stacked column repeated for a total plus six revenue bands, each with its own sample size. Use it to show an overall answer and then how it varies with company size.
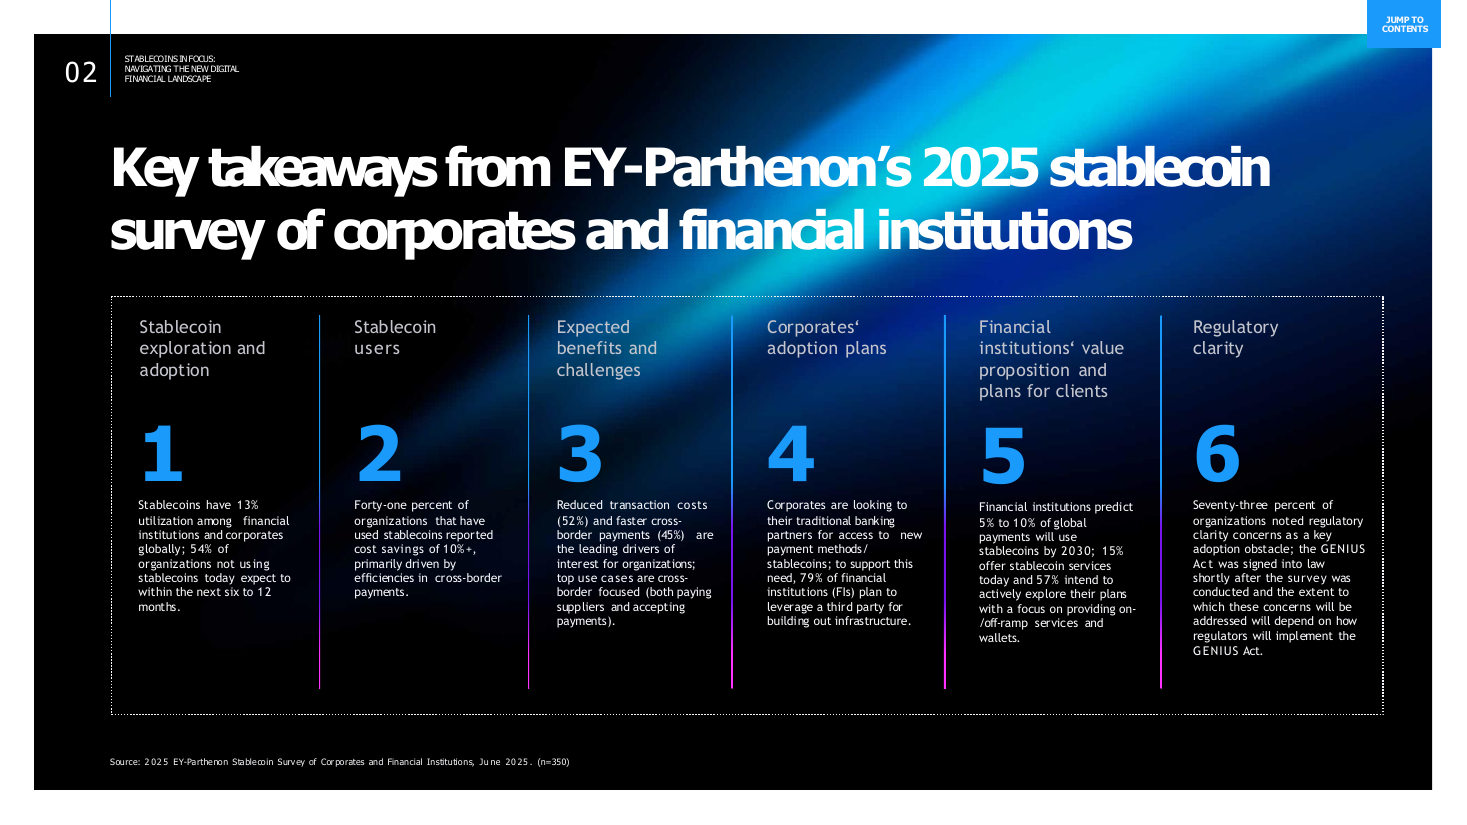
Source: Recreated as a native, fully editable PowerPoint slide from page 21 of Stablecoins in Focus 2025, a publicly published EY-Parthenon deck. Not affiliated with or endorsed by EY-Parthenon.
More like this