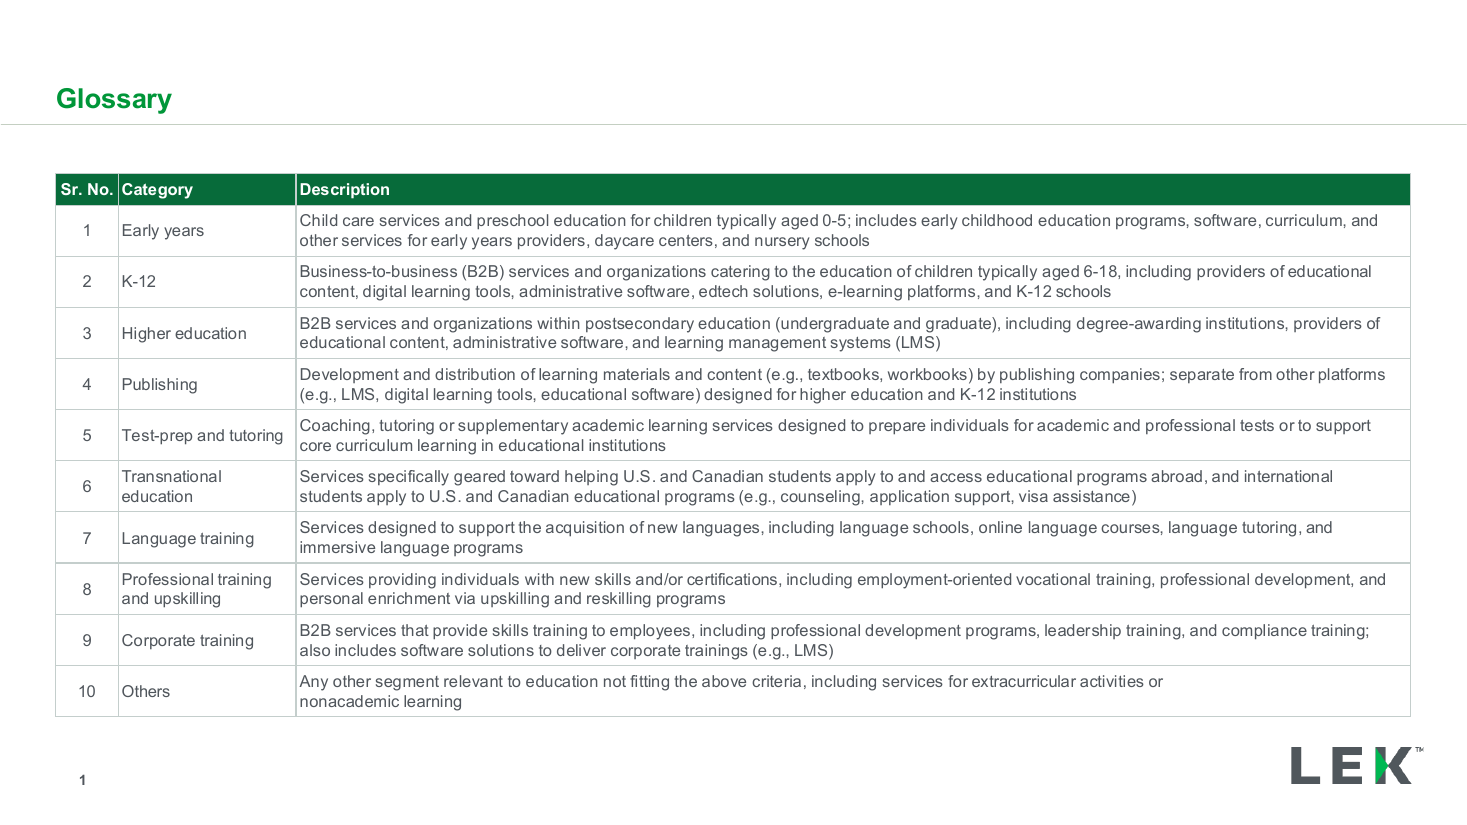
Segment glossary and category definitions table
Three stacked financial tables, one per company, each paired with a commentary box explaining the drivers behind the figures.
Source: Recreated as a native, fully editable PowerPoint slide from page 19 of Squarespace Board Discussion Materials 2024, a publicly published Goldman Sachs deck. Not affiliated with or endorsed by Goldman Sachs.
More like this