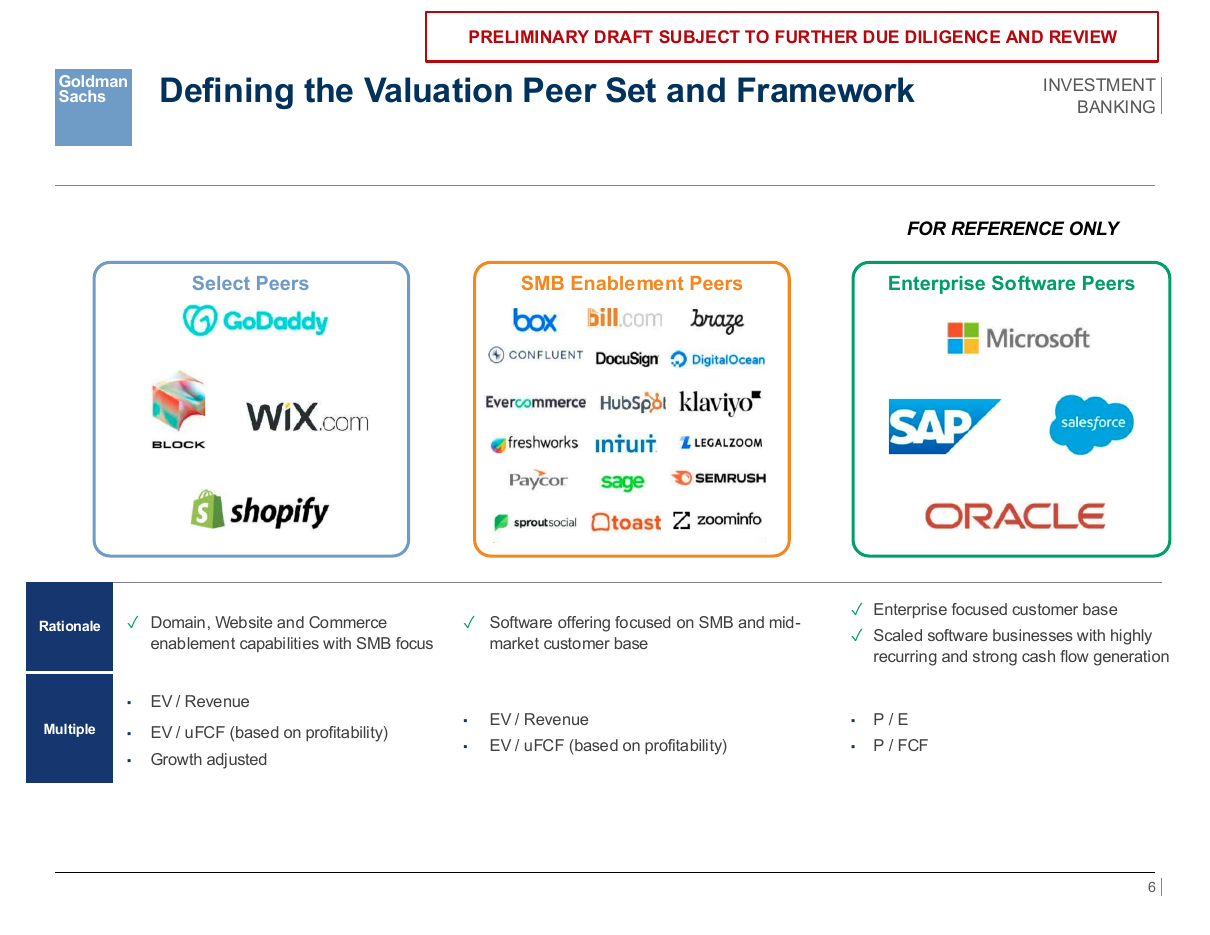
Board discussion materials title page
Two side-by-side scatter charts plotting valuation multiple against growth, each with a fitted trend line, an R-squared callout and every point named in place.
Source: Recreated as a native, fully editable PowerPoint slide from page 11 of Squarespace Board Discussion Materials 2024, a publicly published Goldman Sachs deck. Not affiliated with or endorsed by Goldman Sachs.
More like this