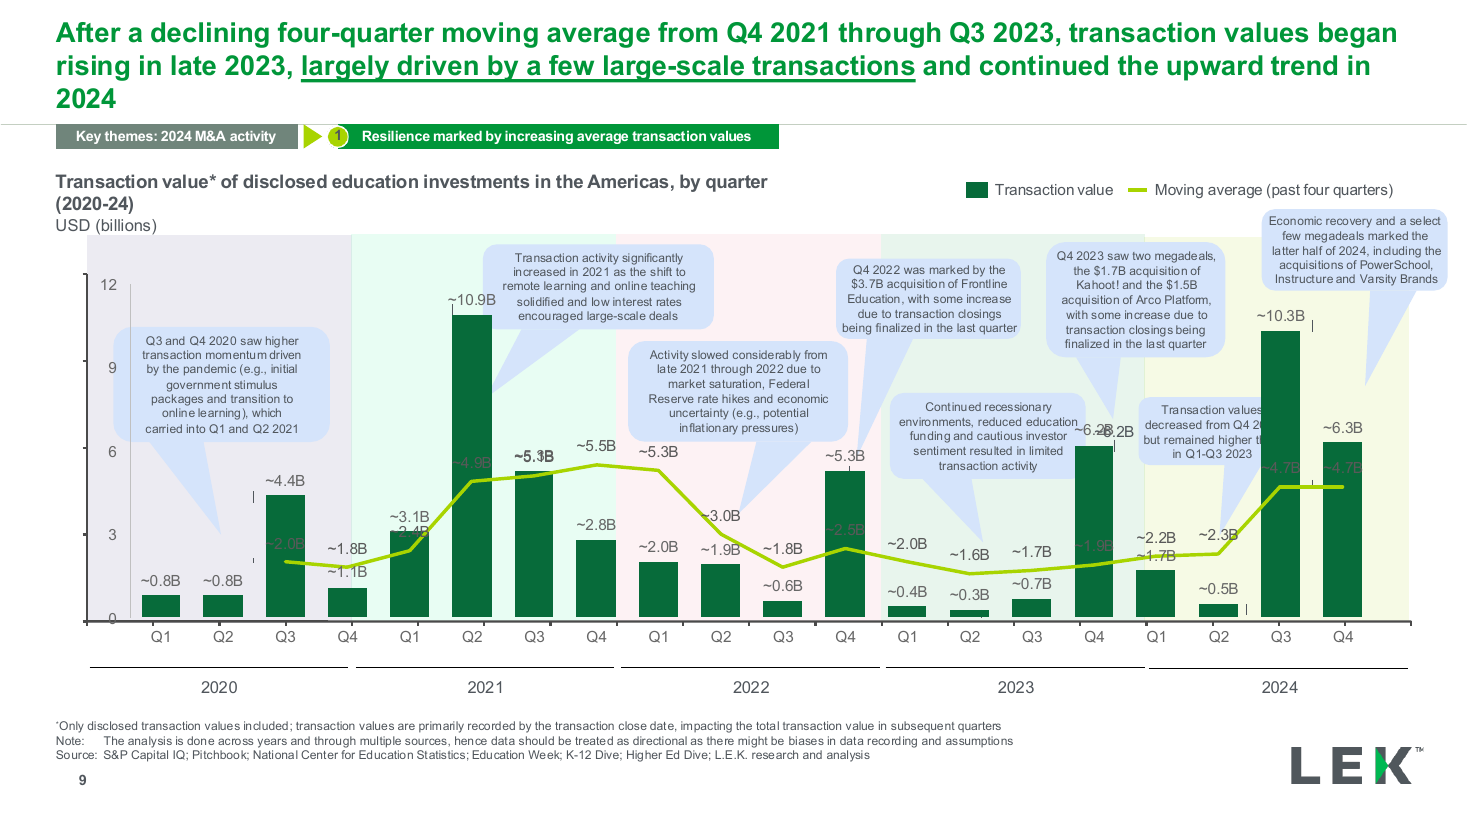
Quarterly value trend with moving average
A left panel holding one oversized percentage and its explanation, paired with two small column charts on the right that break the same figure into a total and a two-way split. Use it to lead with a headline number and immediately show what sits behind it.
Source: Recreated as a native, fully editable PowerPoint slide from page 8 of AI at Work 2025, a publicly published BCG deck. Not affiliated with or endorsed by BCG.
More like this